Mastering the Evening Star Candlestick Pattern: A Trader's Guide to Bearish Reversals
- Sagar Chaudhary
- Dec 27, 2024
- 4 min read

The Evening Star candlestick pattern is one of the most reliable indicators of potential reversals in financial markets. Used extensively in technical analysis, this pattern signals the transition from bullish to bearish sentiment, offering traders and investors valuable insights into market behavior. In this article, we will delve deep into the Evening Star pattern, exploring its characteristics, formation, trading strategies, and how it can be combined with other tools for enhanced effectiveness.
Understanding the Evening Star Pattern
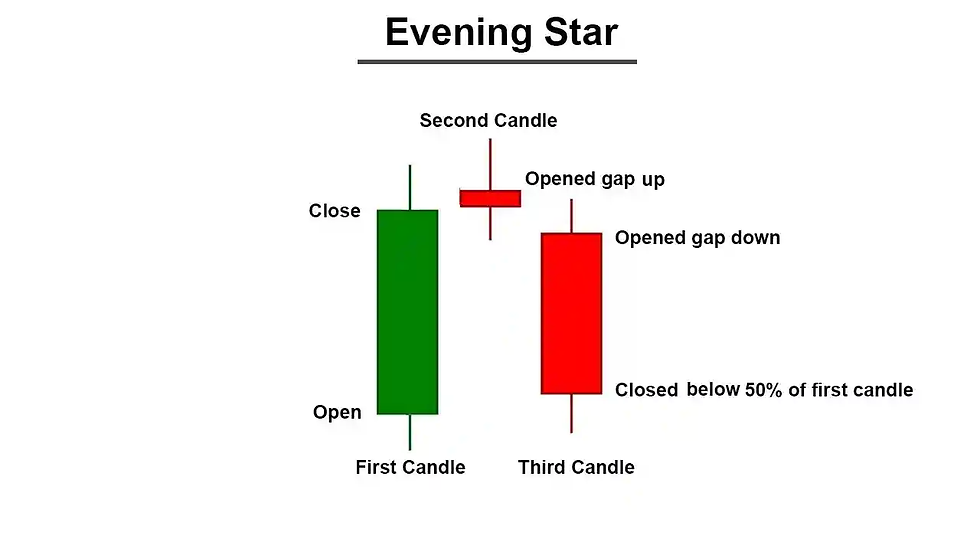
The Evening Star is a bearish reversal pattern consisting of three candlesticks that collectively indicate a potential change in market direction. Here are the key components:
First Candle: A large bullish (green) candlestick that reflects strong buying momentum.
Second Candle: A small-bodied candle that can be bullish, bearish, or neutral. This candle represents indecision in the market, where neither buyers nor sellers have full control.
Third Candle: A large bearish (red) candlestick that closes well into the body of the first candle, confirming the reversal.
The pattern typically forms at the top of an uptrend and is a strong signal that the upward momentum is weakening, paving the way for a potential downtrend.
Formation and Interpretation
Step-by-Step Formation:
Bullish Momentum (First Candle): The market is in an uptrend, and the first candle of the Evening Star is a strong bullish candle. This demonstrates that buyers are in control and pushing prices higher.
Indecision (Second Candle): The second candle is relatively small, indicating a pause in the prevailing trend. This candle often resembles a Doji or Spinning Top, reflecting indecision among market participants.
Bearish Confirmation (Third Candle): The third candle is a large bearish candlestick that closes below the midpoint of the first candle’s body. This confirms the bearish reversal and the dominance of sellers.
Characteristics:
Trend Requirement: The pattern is only meaningful when it appears after an uptrend.
Volume: Increasing volume during the formation of the third candle adds credibility to the reversal signal.
Gap Formation: The second candle often forms a gap above the first, and the third candle forms a gap below the second, further enhancing the pattern’s significance.
Importance of the Evening Star in Technical Analysis
The Evening Star is a reliable tool for identifying potential trend reversals. Here’s why it’s crucial for traders:
Reversal Signal: It provides an early warning that bullish momentum is fading, allowing traders to prepare for a potential downtrend.
Risk Management: The pattern’s structure provides clear levels for setting stop losses and targets.
Versatility: It can be applied across various time frames and markets, including stocks, forex, commodities, and cryptocurrencies.
Trading the Evening Star Pattern
Entry and Exit Strategies
Identify the Pattern: Look for the three-candlestick formation at the end of an uptrend.
Confirmation: Wait for the third candle to close below the midpoint of the first candle’s body.
Entry Point: Enter a short position when the price breaks below the low of the third candle.
Stop Loss: Place a stop loss above the high of the second candle or the high of the pattern.
Target: Use previous support levels or Fibonacci retracement levels to set profit targets.
Scenario:
Imagine a stock has been in a strong uptrend, and the Evening Star pattern forms near a significant resistance level. After the third candle closes below the first candle’s midpoint, a trader enters a short position, sets a stop loss above the pattern, and targets the next support level.
Enhancing the Evening Star with Additional Tools
1. Moving Averages: Combining the Evening Star with moving averages, such as the 20-day EMA, can improve accuracy. If the pattern forms below a downward-sloping EMA, it strengthens the bearish signal.
2. Relative Strength Index (RSI): Using RSI to identify overbought conditions alongside the Evening Star pattern can provide added confirmation of a potential reversal.
3. Volume Analysis: High trading volume during the formation of the third candle adds credibility to the pattern.
4. Fibonacci Levels: If the Evening Star forms near a key Fibonacci retracement level, it increases the likelihood of a reversal.
Common Mistakes and How to Avoid Them
Ignoring the Trend: The Evening Star is only valid after an uptrend. Using it in a sideways or downtrend can lead to false signals.
Entering Too Early: Wait for the third candle to close and confirm the pattern before entering a trade.
Neglecting Risk Management: Always set stop losses to protect against unexpected market movements.
Overlooking Context: Consider broader market conditions and avoid relying solely on the Evening Star pattern.
Forex Market: In the EUR/USD currency pair, an Evening Star pattern appeared on the daily chart near a major resistance level. The subsequent bearish trend provided a lucrative shorting opportunity.
The Evening Star candlestick pattern is a powerful tool for identifying bearish reversals in financial markets. By understanding its formation, characteristics, and application, traders can make informed decisions and improve their trading outcomes. When combined with other technical indicators and sound risk management practices, the Evening Star pattern becomes an indispensable component of a trader’s toolkit.
Remember, no trading strategy is foolproof. Always backtest and adapt the Evening Star pattern to suit your preferred markets and time frames. With practice and experience, this pattern can help you navigate the complexities of the financial markets with confidence.
By mastering the Evening Star pattern, traders gain a deeper understanding of market psychology and positioning, paving the way for consistent success in trading.
For updates, follow @ganntradeing on X
1014, Medford Drive Lufkin Texas 75904 +1 (234) 385-8228
The whole material is copyright by Sagar Chaudhary (Copyright act, 1957 India), please do not publish this article in this real format. Yes, you can analyse this and draft in any format as per your knowledge and publish wherever you want. But not this real format.
Sagar Chaudhary is a trading enthusiast and researcher who specializes in pattern-based analysis and seasonality trading. With a focus on data-driven strategies, Sagar provides actionable insights to help traders achieve consistent success in the markets.


Commentaires